
To read the first part of this two-part series, click here. We discussed how many waterfall projects fail to be delivered as promised due to the planning process taking too long. Either the project deliverables are missed, or they are completed in the wrong order. In addition, there is also often no system for making decisions quickly. Finally, when it looks as though a project will overrun, companies usually revert to even more planning…
This can be reduced to flawed methodology; it’s time for a change of perspective. The first article we shared took you through the first step: ‘Designing the Work’. In this article we will move onto the remaining steps you will need to achieve on-time, in full, and on-budget delivery.
Step 2 – Estimating for the Work
The advent of agile ways of working has resulted in a reluctance to use time-based estimating on any work. Constructs like T-shirt sizing and poker planning arose to guard against Parkinson’s Law and the dysfunctional behaviour associated with targets. Parkinson’s Law suggests that we will fill time allocated for a certain task, and the dysfunctional behaviour associated with targets is our tendency to de-scope or manipulate work to hit due dates. This is not helped by the fact that because senior leaders are rarely involved in planning phases, it is taken for granted that the number of days attached to a deliverable is a fact, rather than an estimate, and must be hit. Thinking this way, we will be unlikely ever to finish early, and rarely know, until very near the end, that we might be late. Estimating, by definition is variable – a reality that we can use to our advantage. We can accept that in the life of a project some deliverables will run late and some will be early – if we just plan for that, we can start to deliver projects on time, or even early.
The next step in our network diagram is to insert time-based estimates. This allows us to see the critical chain of the project (the one that governs the speed of the whole undertaking). The key here is that the team knows these are estimates, and will have a better idea of the due date as things move along. There will be better-informed re-estimates.
A simple way to think about sizing is as follows:
Large pieces of work 20-30 days
Medium 2-5 days
Small up to 1 day
Principle & Practice Summary
Estimating work is tricky, and it can terrify planning teams. But there are ways of changing work culture, to arrive at a more reasonable – and less alarming – way of planning.
Step 3 – Managing Project Delivery, Governance, and Reporting
If a project is going to be late, it’s good to know that early. But how? We’ve said before that focusing on due dates doesn’t allow for reasonable variation in estimates, and really amounts to an arbitrary deadline most of the time. A better way is to create what we call a ‘project buffer.’ This is a device that changes the notion of RAG status, and makes it so that that leaders have to intervene only when they’re needed, and are given a signal early rather than too late.
Here’s how it works.
Let’s say we have a project with a critical chain of 90 days. We’ll take 30 days of that project and call it our project buffer (30% is standard practice). It’s at this stage we now take a deliverable (20-30 days) and break it down to smaller pieces of work. Typically, that’s 1-5 days per chunk. Every day the Project Manager brings everyone together and asks, ‘What’s the remaining duration of your work?’ If the task is on the critical chain and it looks like that has been estimated incorrectly (say, a 5-day task is now actually 10 days) we can use a fever chart (below) to show that we have consumed 5 days of what we had remaining until the end of the project. We know we’re late, in other words.
This chart, combined with the network diagram, allows leaders to make decisions about whether to take action to get back on track or wait to see if natural variation will improve the flow (that happens sometimes). Should teams simply stay out of the yellow or red zones? Not exactly. The rule is that if a project goes into yellow, a recovery plan is built; if the project moves to red, the plan is implemented.
It’s not a bad governance tool overall. Charts are shown visually beside projects, so that leaders can see immediately if projects are on schedule. Also, when a project does go yellow, the reason for the consumed buffer is captured in the problem-solving log. All instances of yellow and red do need to be captured. Leads can review them and start to work on common problems across projects.
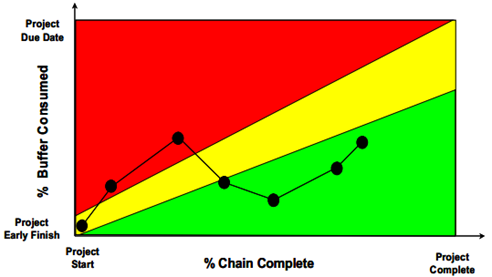
Figure 1: ‘Fever Chart’
Principle & Practice Summary
Again, leaders have a further opportunity to improve culture, this time by supporting projects when they go yellow and red, and encouraging people to report the correct status. Work is optimised as we understand the time it takes to deliver value and gain insight on the problems slowing the work. Teams that collaborate like this reinforce each other, as resources and problems are shared.
Step 4: Day-to-day Running and Project Ceremonies
To keep projects on track, we like to use these agile ‘ceremonies’:
- A daily stand up, to check the remaining duration of tasks, with the project buffer being updated and problems captured (team).
- A daily problem-solving meeting, to discuss the progress with any project blockers (team and leaders).
- A twice-weekly buffer-management meeting, to discuss buffer consumption and recovery actions.
- Process confirmation for project leaders, to check that the project is following the rules of engagement.
- Fortnightly role-clarification to ensure that everyone knows who has accountability for what.
Daily routines and ceremonies are required to manage team tasks, check for late running and recovery actions, solve problems, and also check that the rules used to run projects are being used. This is called ‘process confirmation.’
Project rules work like this:
Imagine you’re trying to lose weight. Your trainer tells you that if you follow a certain routine and calorie reduction, you’ll lose fat. But after a month nothing has happened. Either the trainer was wrong, or you didn’t follow the rules. Sound reasonable?
It works that way in business life too. In our real-life digital case above, there were clear rules for running the project, but they weren’t followed. What made it worse is that nobody knew this until after the project ran into trouble!
Process confirmation would have allowed the leaders to coach project teams on how to stick to the rules, and also how to change the rules if the rules turn out to be wrong-headed. It’s a daily and weekly set of routines.
We’ll leave you two rules to go along with your process confirmation regimen.
- Once you start a task you must work on it till the end. Because shifting focus costs so much time, we don’t start a new piece of work until we have finished.
- If you are blocked, stop and get it sorted. Do not move to the next task. Here, you call your Project Manager. If you don’t, you’ll only flood the system and decrease output; you might also disrupt the critical chain.
Principle & Practice Summary
With the right tools, and the right routine of ceremonies, projects can be kept on track. Reporting? That’s just part of the work.
Step 5 – Task Management
It’s obvious by now that on-time delivery, to agreed specifications, is a matter of good management. The agile way to manage is to break down large deliverables, to smaller objectives, and then to tasks.
It’s the team that’s supposed to break the work from deliverable to objective. Only those working on the smaller objectives should break these down to tasks, however.
What’s a task? It’s 30 or 40-minute chunks of work – the aliquots of work that we as humans are naturally used to doing at one time.
Tasks should be described clearly. People do them best when they’re described not as ‘test the work’, for example but ‘use the checklist see if the work complies with X.’ Clear and bite-sized tasks are good for productivity.
Objectives? Track those on a Kanban board.
Why?
- Management can see the rate of Throughput.
- Management can see where the resource constraints lie, if work is building up.
- Management can check that the work is in sync with the network diagram.
Principle & Practice Summary
In summary, the key to getting this right is a move to collaborative planning, concrete language around done, time based estimating, forward looking measures and time based estimating.
Step 6 – Project Measurement and Reporting
The following should be measured on LRM projects.
- The rate that the portfolio of projects is delivering on time, in full and on budget.
- Buffer consumption for each project.
- Reasons for buffer consumption.
- Budget burn down.
- Number of open problems vs number solved.
Summary
Good project management is a combination of a few factors. Great communication, collaborative planning, concrete language, time-based estimating and great task management.
Goldratt UK works with clients in both project and production environments to increase output, shorten lead-times and improve delivery performance. If you would like to view a case study of these ideas implemented within a project management environment, request one at [email protected].
© 2021, Goldratt UK